The Distribution Strategy Group (DSG) conducted its 13th Annual State of E-Commerce in Distribution survey in Q4 of 2022, updating the leading benchmark in distribution in both adoption and drivers of e-commerce in the wholesale distribution industry.
Eighty-six IMARK Electrical members participated in this survey. More than 400 responses in total were received from people working in the following distribution industries: building/materials construction, electrical, HVAC/R, hardware, industrial, jansan and oil and gas.
For the purpose of this survey, e-commerce is defined as website, mobile and app transactions but excludes EDI, punchout and email/fax transactions.
Industry Participation in E-Commerce (By Size)
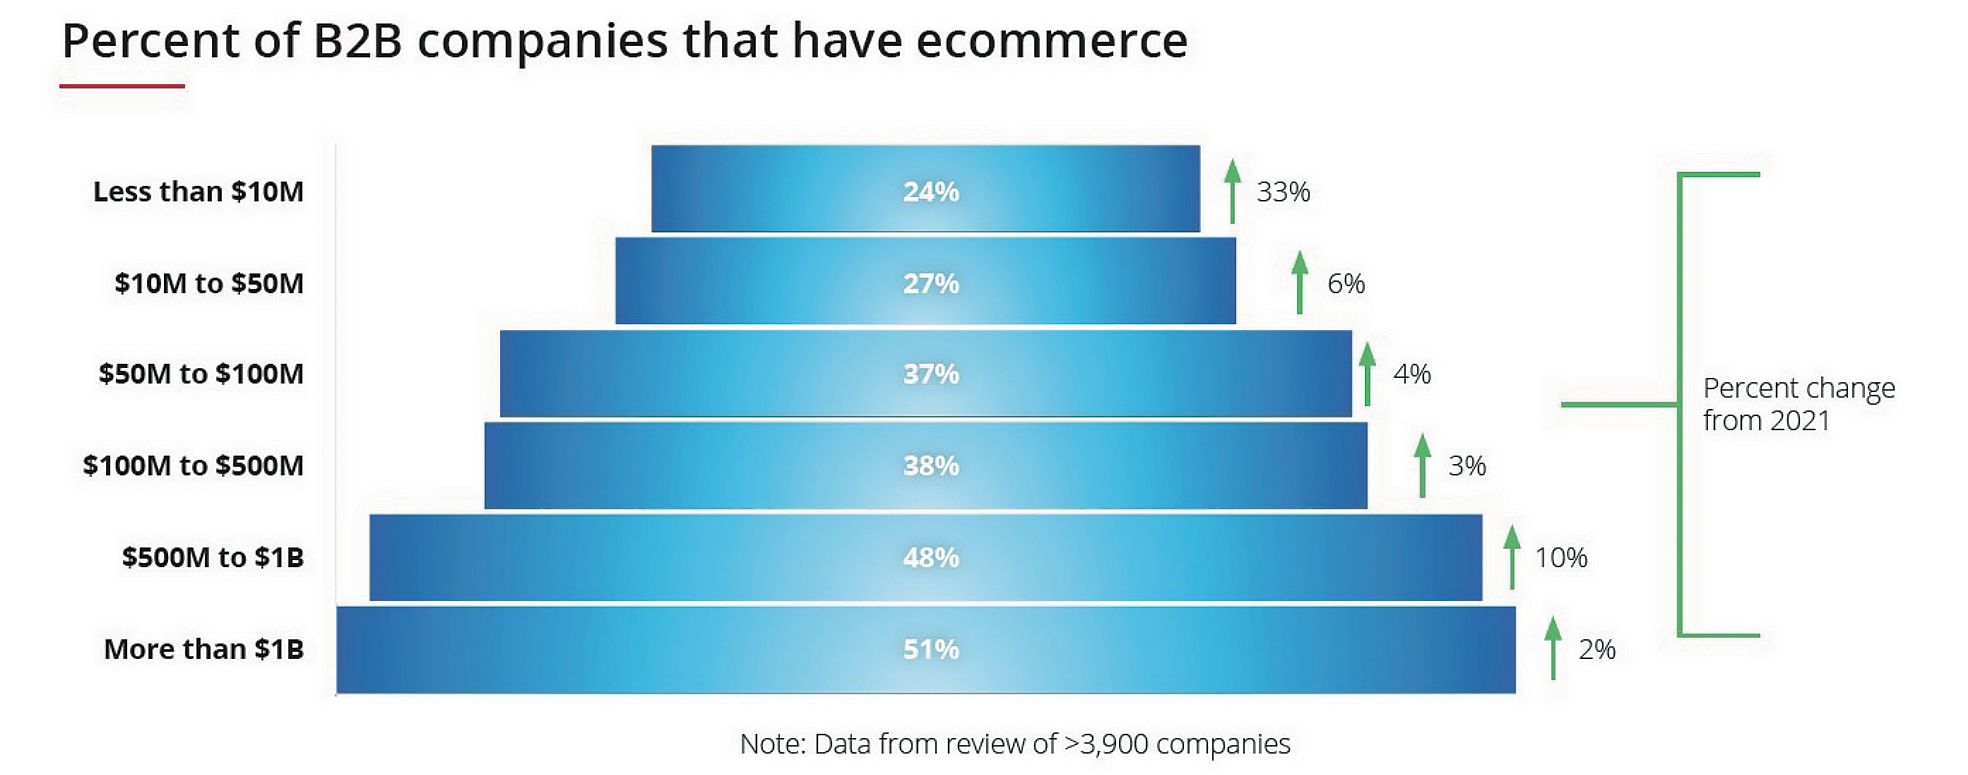
To get this data, DSG analyzed 4,000 B2B websites of wholesale distributor companies. Not surprisingly, the larger the company,
the more likely it was likely to offer e-commerce in some form.
- 51% of analyzed companies reporting $1 billion in revenue offer e-commerce
- 37% of analyzed companies reporting between $50 and $100 million in revenue offer e-commerce
- 27% of analyzed companies reporting between $10 and $50 million in revenue offer e-commerce
- Less than 25% of analyzed companies with revenues less than $10 million offer e-commerce
Despite the lower numbers for smaller companies, we see the adoption rates for smaller companies growing due to the ongoing explosion of more affordable e-commerce platforms, better product data and digital and online expertise.
Maturity Rate Up 8.5% in 2022 Versus 2021
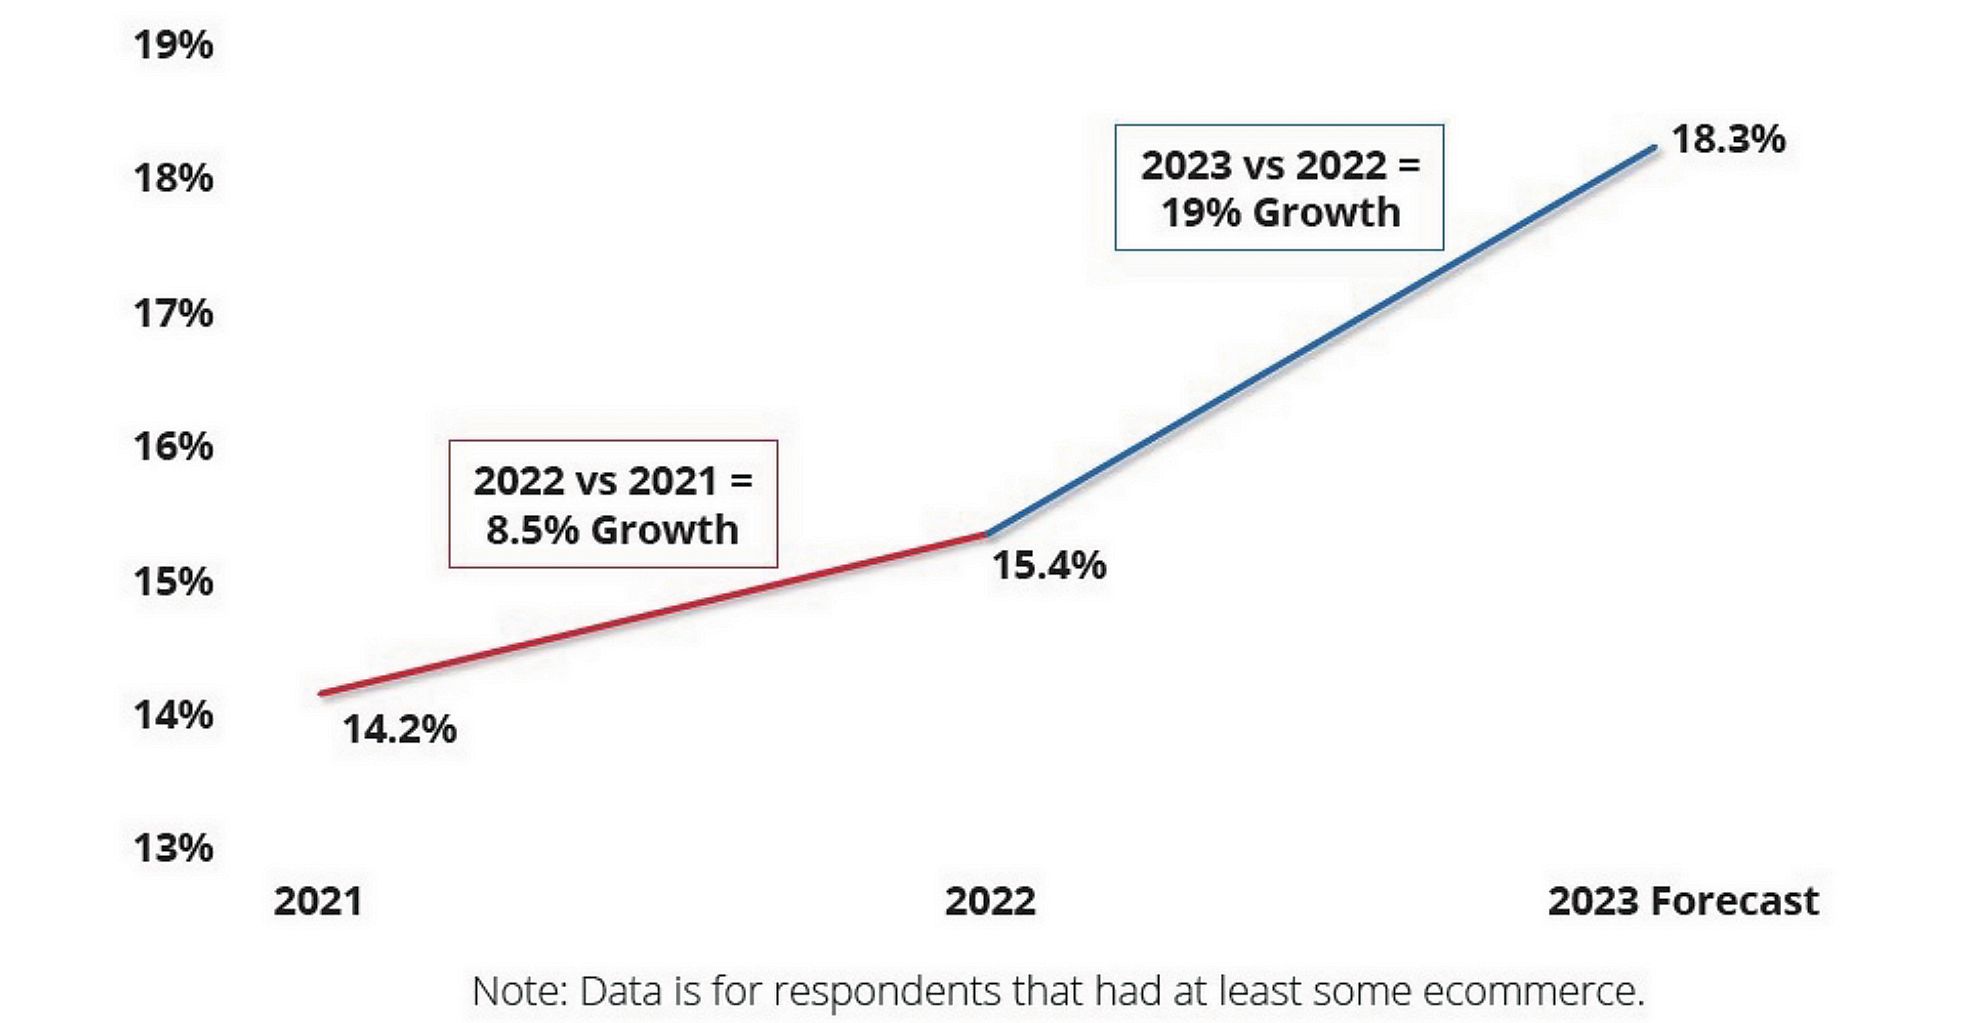
The e-commerce maturity rate measures the percentage of overall revenue that is placed through an e-commerce channel as a percentage of overall company sales.
We predict a 19% increase in the percentage of total revenue e-commerce makes up on average to 18.3% in 2023.
2023 Forecast: Maturity by Sector
We characterize a distributor as having reached e-commerce “maturity” if its sales via e-commerce as a percentage of total sales is between 10% and 20%. Generally speaking, the more complex and interrelated the product, the more challenging it is to reach maturity.
74% of IMARK Electrical members reported that e-commerce sales were less than 10% of the total. 26% of IMARK members indicated that their e-commerce sales accounted for more than 10% of total sales.
Note: On average, IMARK Electrical member respondents estimated that 4.7% of their 2022 sales came via e-commerce. For 2023, IMARK respondents expect this to increase to 7.9%.
 This graph shows that approximately 47% of electrical distributors (that offer e-Commerce) can receive an order placed via e-commerce and that sales via e-commerce represents less than 10% of total sales.
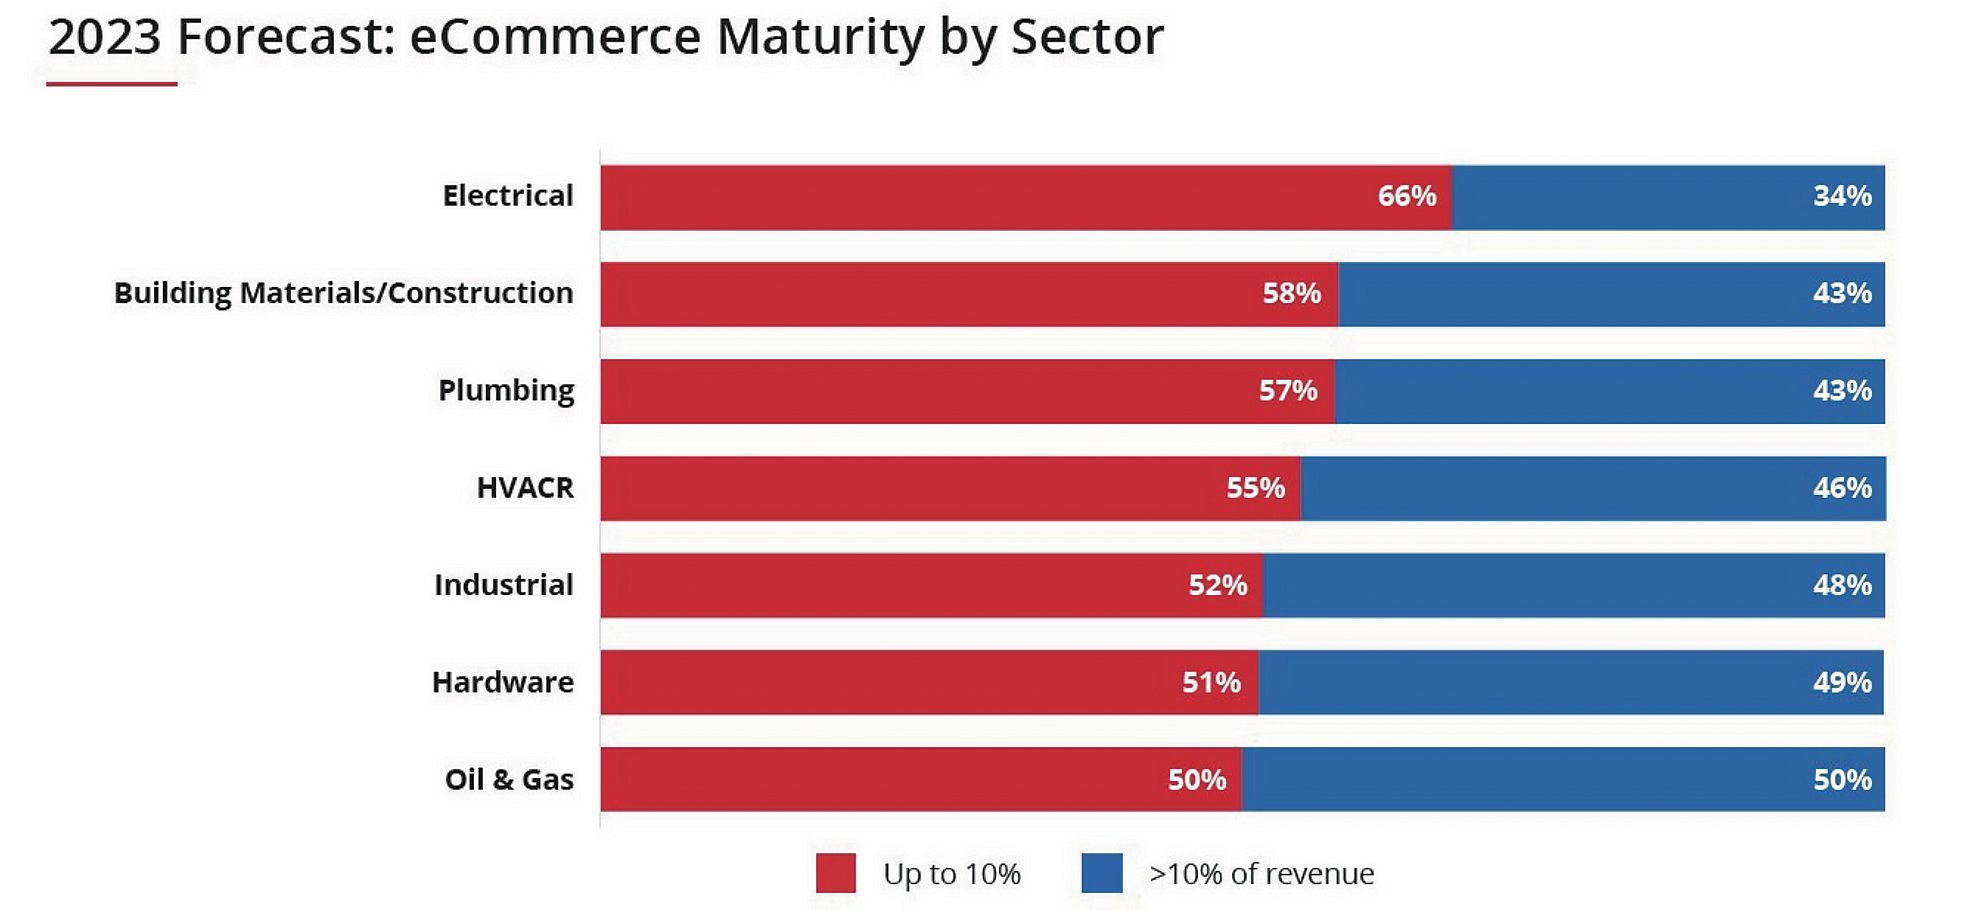 34% of electrical industry respondents project that 10% or more of their total revenue will be processed via e-commerce.
Satisfaction with E-Commerce Investment
Just 40% indicated that they are at least moderately satisfied with their e-commerce as a result of their company’s investment. About a third said they are only slightly or not at all satisfied. The remaining 26% had no opinion or it was not applicable.
Reasons for dissatisfaction generally fall within three categories:
- Not using the right technology and/or not using it correctly
- Inadequate product and/or pricing information
- Inadequate (or non-existent) marketing of e-commerce resources and solutions
Another issue is that companies may not consider all of the other benefits of an e-commerce platform, including the ability of e-commerce to drive sales through other ordering channels offered by the company.
Many B2B buyers cannot “check out” via your shopping cart even if they wanted to. Instead, customers may spend all day shopping on your website, browsing products and building an order—and then transact through the corporate-approved method to purchase, whether that’s through EDI, email, a formal PO, a call to sales or customer service or at the branch.
What’s more, distributor websites are often the most expensive channel for a customer. Because there may be discounts available through other points of contact, many buyers will contact a sales rep to secure a lower price. That’s why it is important to have consistent pricing regardless of the channel preferred by the customer.
However, the fact that your customers are not placing orders in your shopping cart does not make your site any less valuable—you just may not be giving it enough credit. Distributor websites will provide value by offering customers a way to shop and learn regardless of where they opt to place an order.
The ‘Point Guard’ Analogy
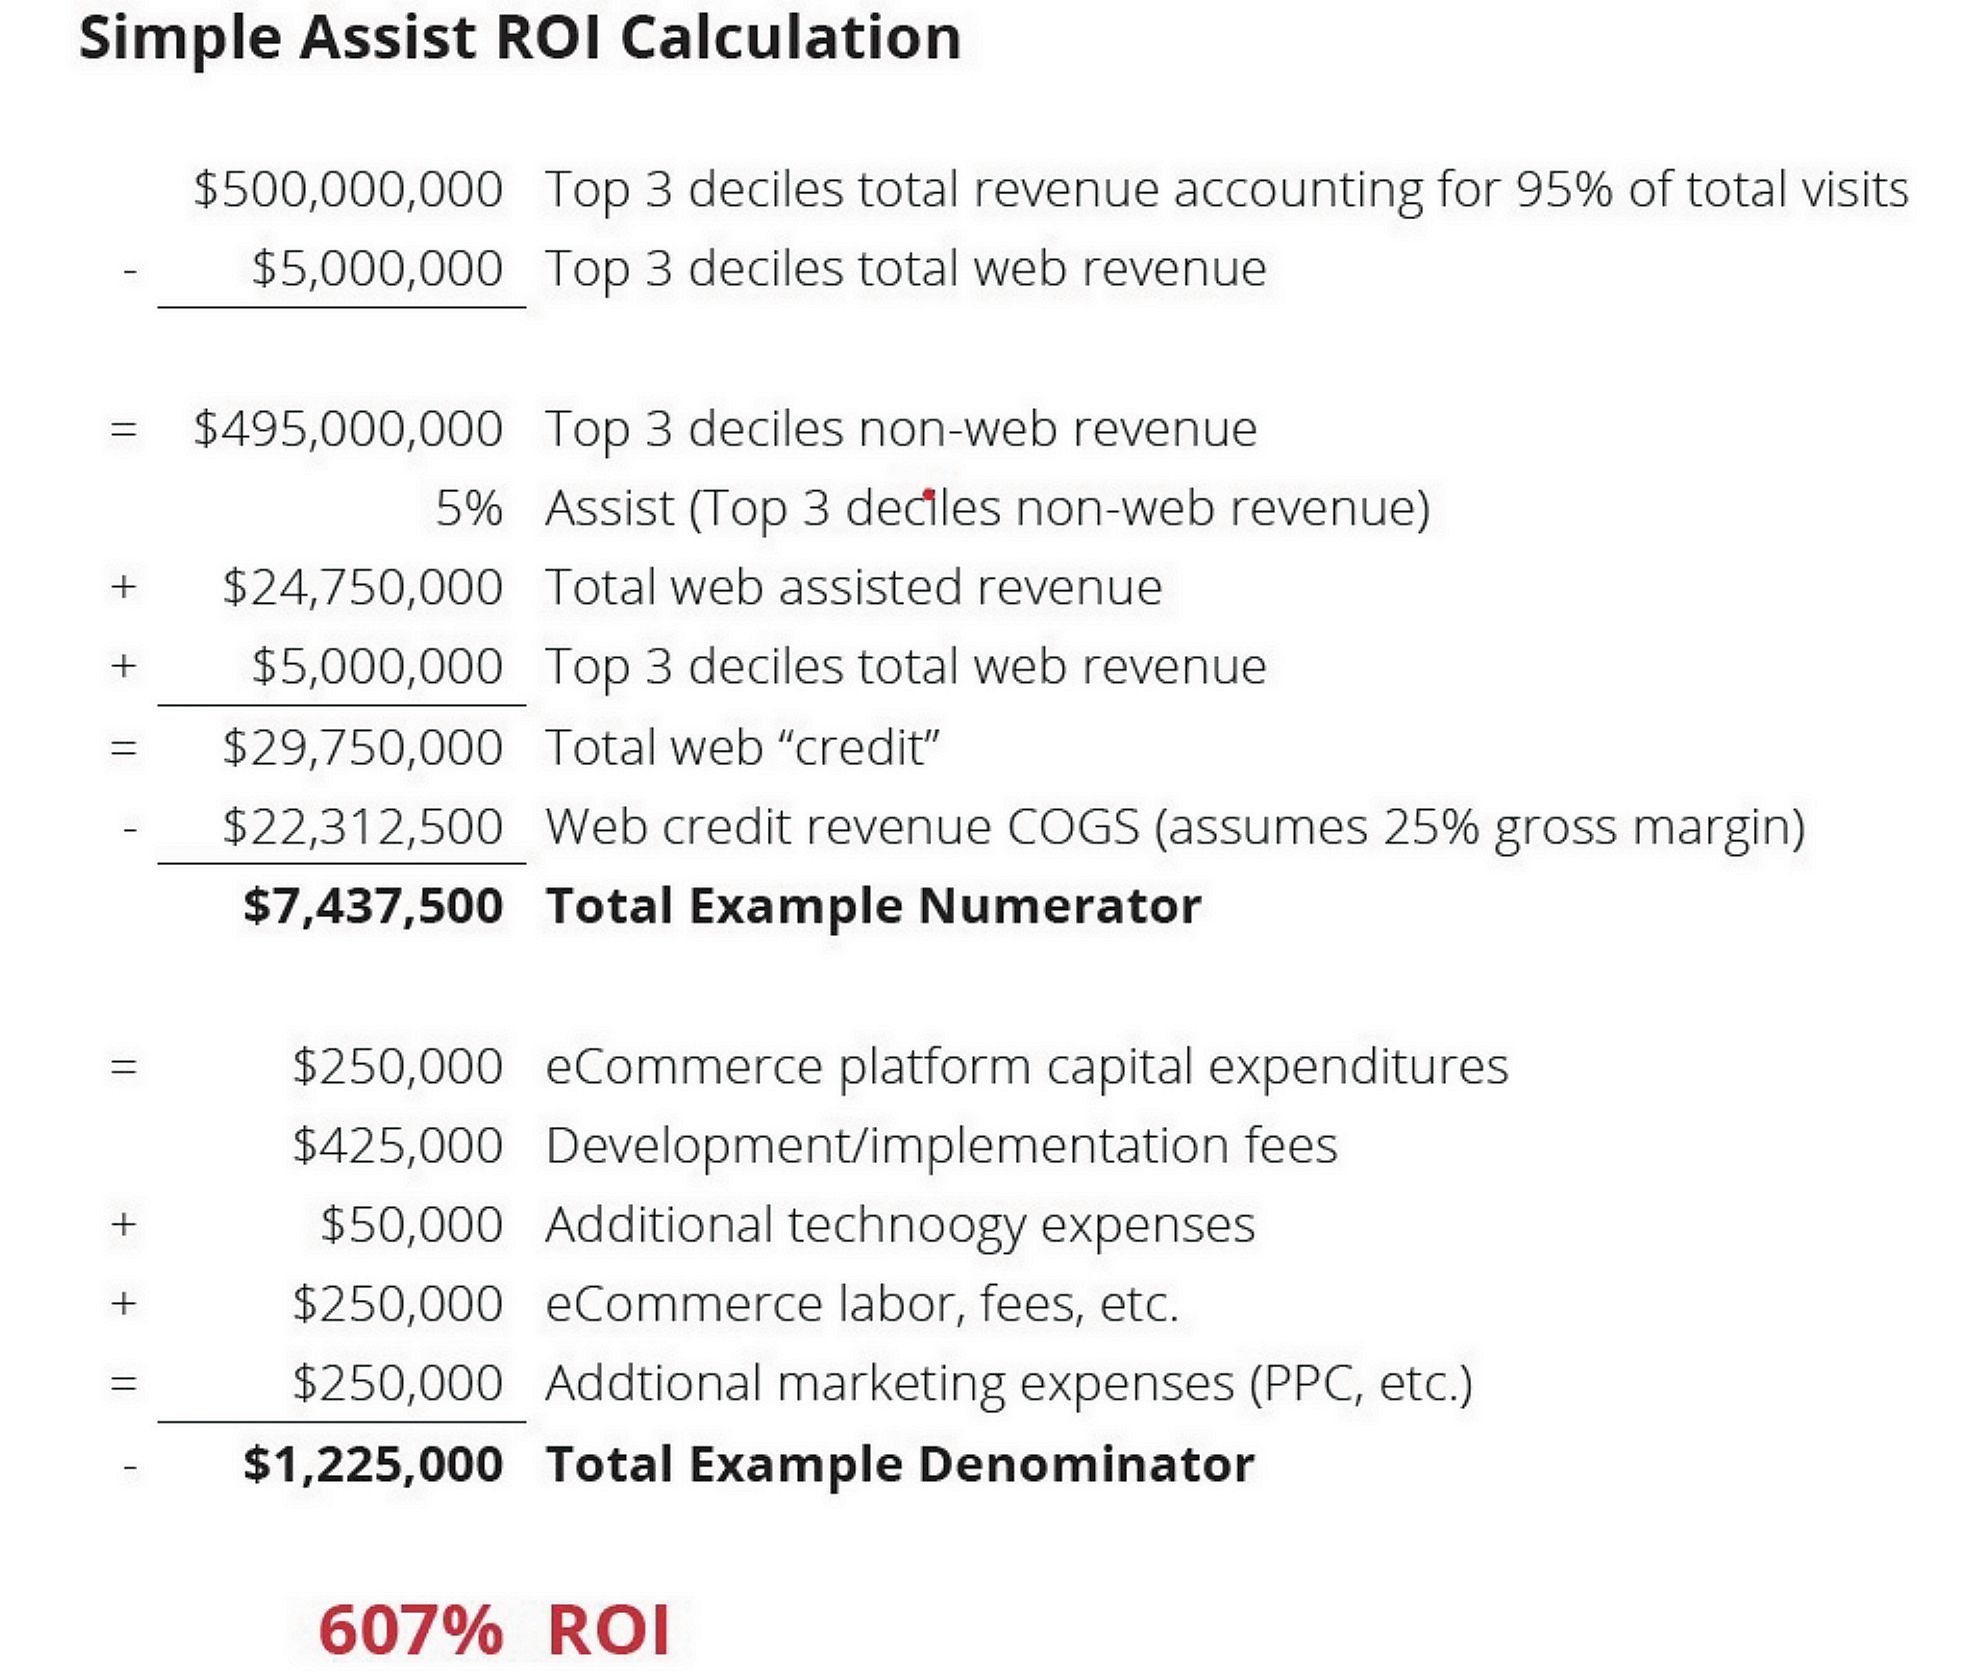
We encourage our clients to think in terms of basketball. Great point guards in the NBA are rated on a statistic called “point creation.” They are credited with creating points not only when they score a basket, but by passing to the player that does score (also known as an assist). That is often the role of your website; sometimes it will score directly through the shopping cart and sometimes it will get an assist by generating a transaction that is placed using another method.
To gain a complete picture of how well your website is performing, you will need to take several factors into account including:
- Shopping cart profits
- All digital profits (EDI, email orders, punch out, etc.)
- Orders generated by website but placed via other channels
- Omnichannel impact (various ways that customers interact with your company)
- Customer lifecycle, including improvement in number of new customers, retention and wallet share
If we knew then what we now know about the impact a website would have on the success of other ordering methods, many distributors would have invested more and earlier into their online presence.
Most Effective Channel in Driving E-Commerce Demand
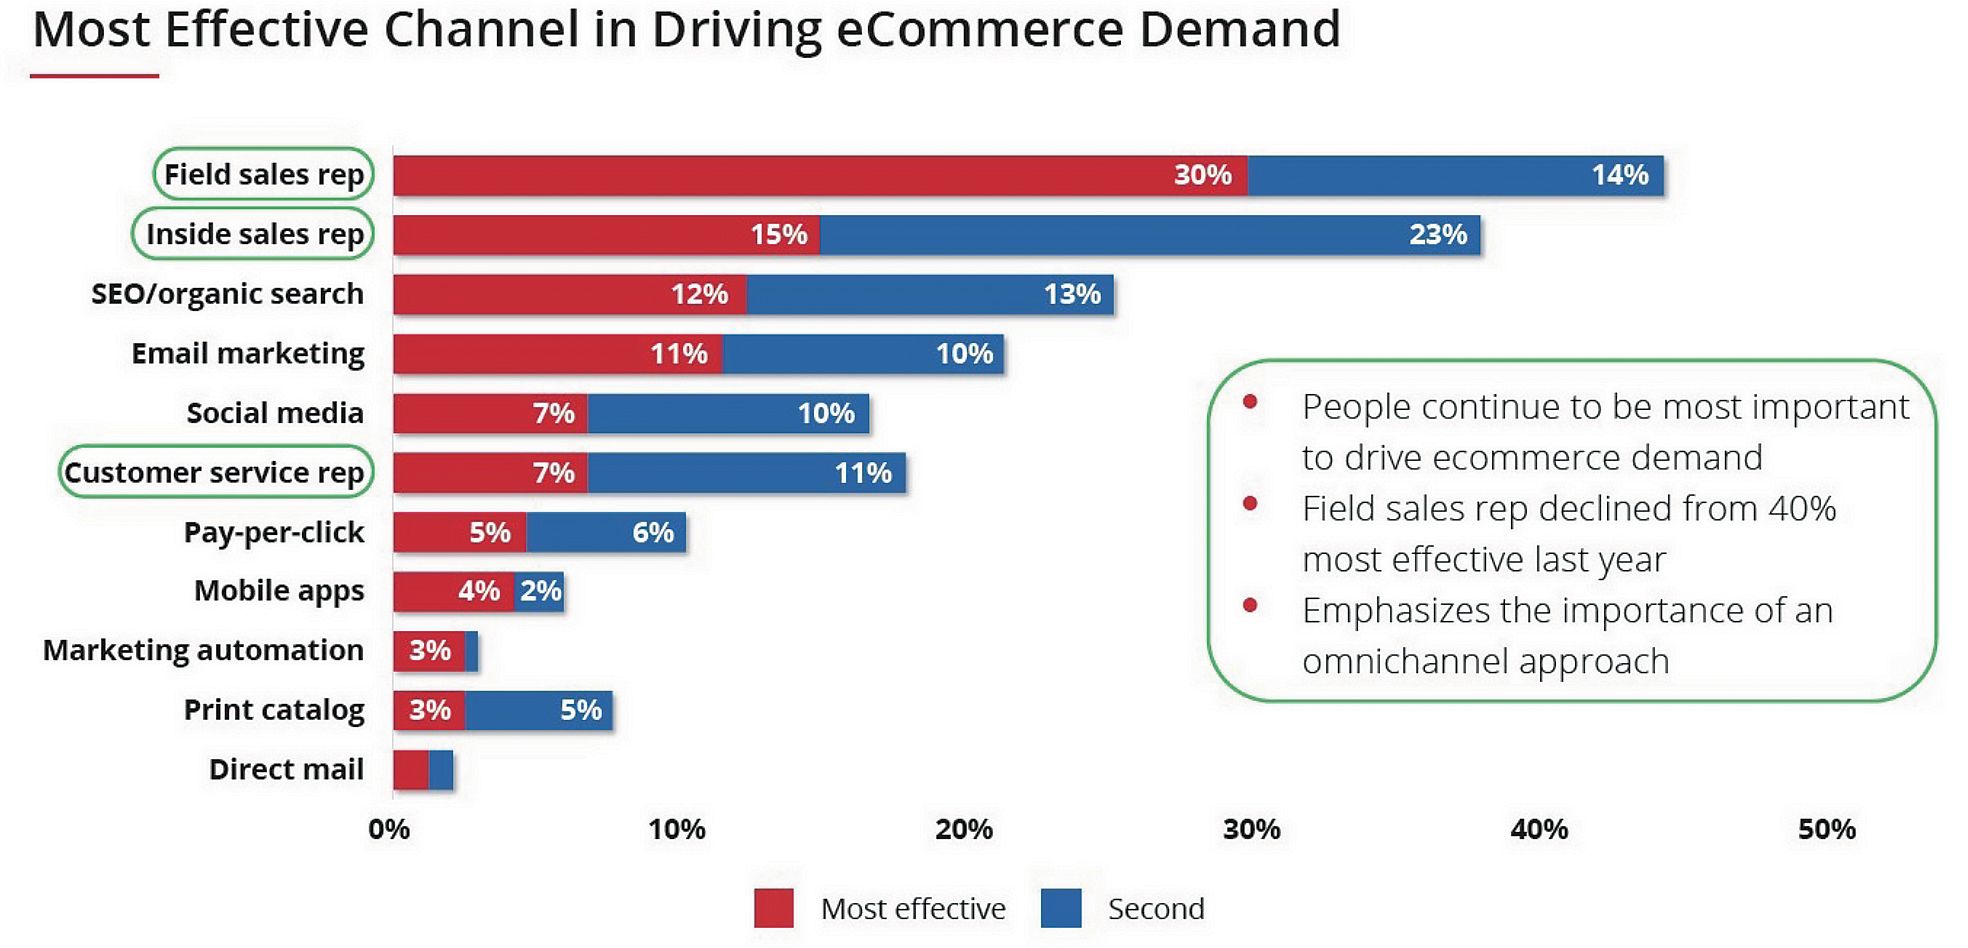
People play a big role in driving e-commerce demand from customers. We found that field sales reps and inside sales reps are still the most effective in driving demand for e-commerce. The data also emphasizes the importance of an omnichannel approach. A variety of channels can drive traffic to your website as demonstrated by the survey results below.
The Opportunity Ahead
Many of your customers begin their shopping experience online (your website or someone else’s) even if the final transaction is conducted offline. There is a direct correlation between users on your website and purchasing.
- Digitally engaged customers and those who visit websites recently (within the past 30 days) buy a lot more online and offline than frequent website visitors.
- Large customers are much more digitally engaged. Digital engagement correlates to customer size.
The bottom line: Distributors need robust shopping and account management capabilities even if shopping cart revenue is minimal.
Here’s our recommended checklist to build a successful e-commerce strategy by 2025: